Same moment, different cities: how much of the sky do we share?
Published on · Reviewed on
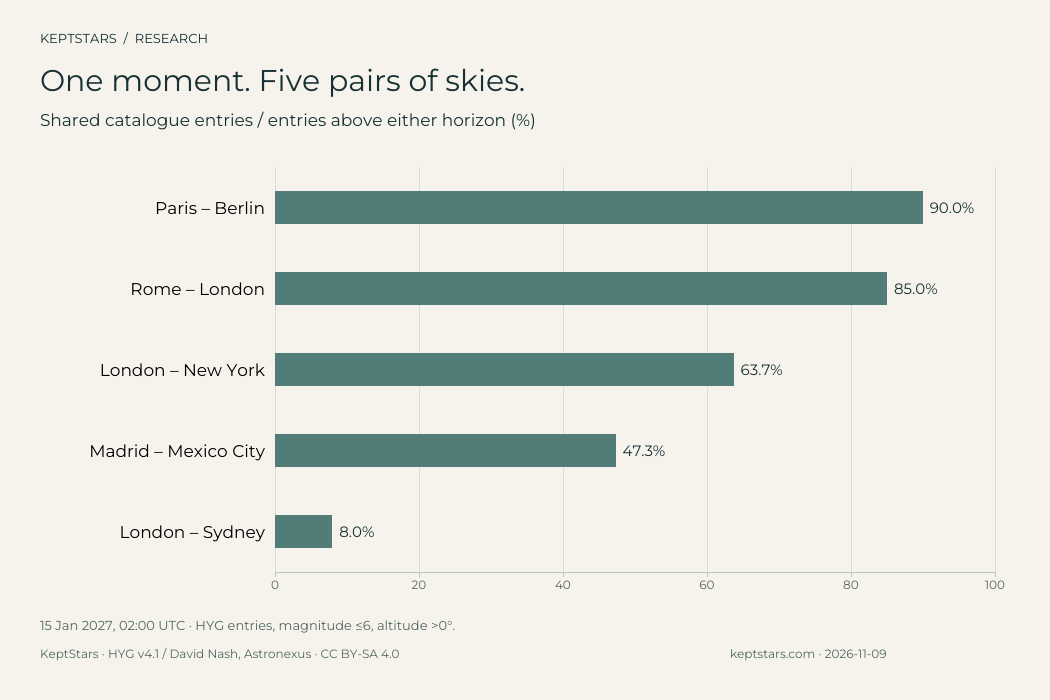
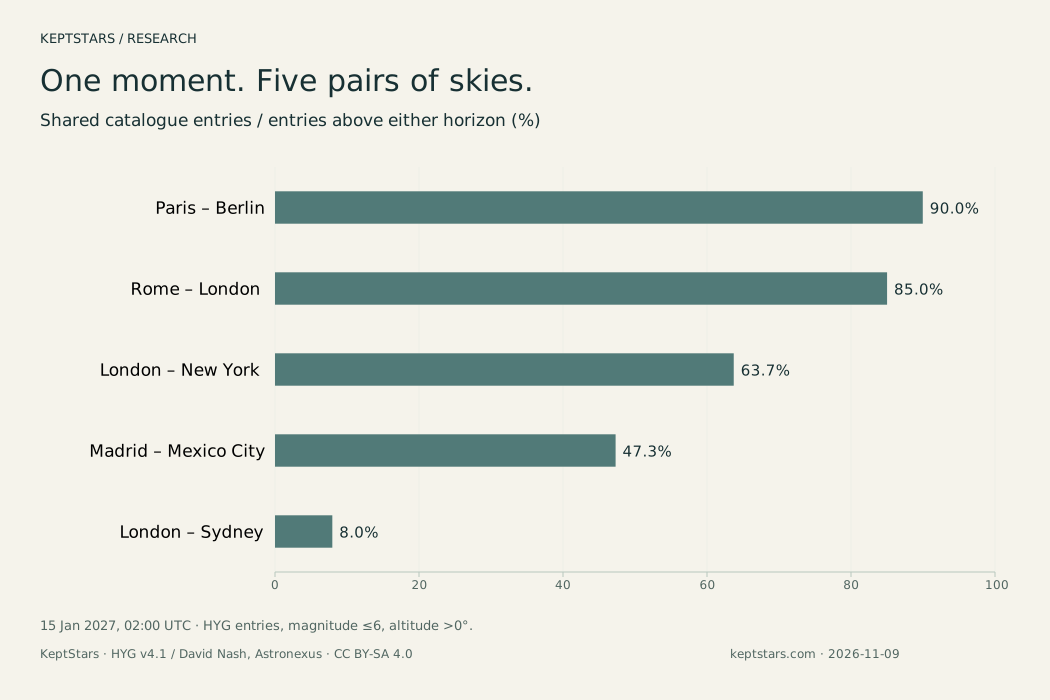
In our 15 January 2027, 02:00 UTC snapshot, London and New York share 1,949 catalog stars above their horizons: 63.7% of the combined set. Paris and Berlin overlap by 90.0%; London and Sydney by 8.0%. Those are geometric comparisons, not promises that the stars are visible.
“We are looking at the same sky” can mean two different things. The same star may be above both horizons, yet daylight can hide it from one person. We calculated both the shared stars and the time when selected cities are dark together. The distinction matters if you want to arrange a call under the stars—or preserve one moment in two places.
Five pairs, one simultaneous moment
Our main snapshot is 15 January 2027 at 02:00 UTC. That is 02:00 in London, but 21:00 on 14 January in New York. Madrid is at 03:00 on 15 January; Mexico City is at 20:00 on 14 January. A shared moment does not necessarily have a shared calendar date.
Paris and Berlin have the greatest overlap among these five examples: 2,332 catalogue entries above both horizons, out of 2,592 above either one. London and Sydney share 368 out of 4,622. It is 13:00 in Sydney, so that last figure describes stars geometrically above the horizon in daylight.
These are selected examples, not a ranking of cities or a percentage that stays fixed through the night. The download also includes snapshots at the same UTC hour in April, July and October.
| City pair | % |
|---|---|
| Paris – Berlin | 90.0 |
| Rome – London | 85.0 |
| London – New York | 63.7 |
| Madrid – Mexico City | 47.3 |
| London – Sydney | 8.0 |
Compare the two skies
Choose a city pair to compare the same instant. The overlap measure divides the number above both horizons by the number above either horizon. Each catalogue entry is counted once in the combined set.
For London and New York, that is 1,949 ÷ 3,059 = 63.7%. A different question—what share of London’s own above-horizon catalogue entries is also above New York?—gives 78.2%. Both numbers are valid, but they use different denominators.
Loading the data…
A shared star is not always a shared night
We also calculated overlapping astronomical darkness across four complete UTC dates. Here, darkness means that the Sun’s centre is more than 18° below the horizon in both locations. It says nothing about clouds, streetlights or the Moon.
On 15 January, London and New York have about 6 hours 29 minutes of shared astronomical darkness within that UTC day. Madrid and Mexico City have about 4 hours 25 minutes. On 15 July the corresponding totals are zero and 18 minutes. London does not reach the required depth of darkness on that July date.
A daily total can contain portions of two nights. The downloadable windows include both local dates and UTC offsets, so you can see when each interval occurs. London and Sydney have no shared astronomical darkness on any of our four sample dates; this is not a claim about every date of the year.
Why a clear horizon changes the result
A star just above the horizon qualifies for our main count. In practice, a nearby building, a hill or atmospheric haze may conceal it. We therefore repeated the comparison using only entries more than 10° above each horizon.
London–New York overlap falls from 63.7% to 56.6%. Madrid–Mexico City falls from 47.3% to 39.8%. London–Sydney falls from 8.0% to 0.8%. This stricter cut is a sensitivity check, not a complete model of what your eyes can see.
The catalogue’s brightness limit is also a selection rule. We count entries with visual magnitude 6 or brighter, but some multiple-star components remain separate catalogue entries. We have not established that a person can resolve or see every entry without a telescope.
How to use this for a shared moment
- Agree on one instant. Write down both local times and dates. “Nine tonight” is not enough when you are in different time zones.
- Check darkness separately. A shared-star count can remain high while one city is in daylight. Use the time windows as a starting point, then check the forecast and your own horizon.
- Choose a recognisable target. In the January snapshot, Sirius, Capella, Rigel and Betelgeuse are above both London’s and New York’s horizons. Their inclusion does not guarantee a clear view from your location.
- Label a keepsake accurately. Two charts can preserve the same instant in different cities. If the times are chosen independently, describe them as two moments instead.
Our guide to the sky on a particular date explains why time and location change a map. A personalized star map can preserve those inputs; it cannot reconstruct clouds or a historical photograph.
Data, method and limits
We selected 5,070 entries from HYG v4.1 with catalogue visual magnitude ≤6.0, excluding the Sun. Skyfield 1.54 calculates directions from nominated city coordinates using the entries’ motion and distance data, Earth’s changing orientation, and the JPL DE421 ephemeris. Counts use altitude strictly above 0°, without atmospheric refraction; a second calculation uses 10°.
The four snapshot dates are 15 January, April, July and October 2027, each at 02:00 UTC. Darkness totals use one-minute midpoint samples through each entire UTC date. Window boundaries have roughly one-minute precision. Coordinates, local offsets, raw counts, the selected catalogue and calculation code are provided for reproduction.
We do not model terrain, buildings, cloud, light pollution, lunar glare, changing stellar brightness or eyesight. Future time-zone rules and Earth-rotation estimates can change. This is a model comparison prepared by KeptStars Team, not an observational survey or independent expert certification.
Download, cite and reuse
The downloadable tables include shared counts, combined counts, both percentages and all sample dates. Use the main result with its time, brightness cut and definition intact; “London and New York share 63.7% of all stars” would misstate the study.
Suggested credit: KeptStars Team (2026), Same moment, different cities: a shared-sky comparison. Catalogue: HYG v4.1, David Nash / Astronexus. The adapted data and charts are available under CC BY-SA 4.0. Credit both sources, identify changes and retain the same licence for adaptations. A link to this study helps readers inspect the calculation.
Download the data
- shared-sky-snapshots.csv · CSV
- shared-darkness.csv · CSV
- Method and reproducible files · ZIP
- Reusable chart: PNG · SVG · PDF
CSV column names and reproducibility notes are in English. Charts and this article are localized.
CC BY-SA 4.0 · KeptStars · HYG v4.1 / David Nash, Astronexus · CC BY-SA 4.0
Can people in different countries see the same stars?
Often, but the overlap depends on the locations and instant. Our model counts stars above both horizons. Actual visibility also depends on darkness, weather, light pollution, obstructions and the observer.
Should both people use the same local time?
Use the same UTC instant when comparing one shared moment. Local times—and sometimes dates—will differ. Using 21:00 in each city usually compares two different instants.
What does the overlap percentage measure?
It is the number of selected catalogue entries above both horizons divided by the number above either horizon, multiplied by 100. It is not a percentage of all stars or the whole celestial sphere.
Can London and Sydney share stars when one city is in daylight?
Yes, geometrically. At our January snapshot, 368 selected entries are above both horizons, but Sydney is in daylight. That is not a shared stargazing session.
Can I reuse the figures and charts?
Yes. Credit KeptStars and HYG v4.1 / David Nash, Astronexus; state the snapshot and metric, identify changes, and retain CC BY-SA 4.0 for adaptations of the data or charts.
Sources and notes
Research by KeptStars Team. Scope, assumptions and limitations are explained in the method section.