Real stars.
An honest picture.
We calculate a sky for a place and a specific time. That is different from a photograph of what someone actually saw: weather, daylight and light pollution are not shown.
The live designer
The live chart uses the HYG star catalogue, sidereal time and a stereographic projection. North is up and east is left, following this sky-chart convention. It draws stars above the geometric horizon, down to magnitude 6.5.
This fast preview uses J2000 catalogue coordinates without precession, proper motion or atmospheric refraction. It is a layout preview, not the final rendered proof. It does not display the Moon, planets or the Milky Way.
The rendered collection
The examples use a separate process with an ESO Milky Way panorama, Skyfield/JPL ephemerides and NASA planet images. The Moon and planets are enlarged for legibility. Planet textures are illustrative, not photographs from the selected date. The panorama has approximately 1–2 degrees of local alignment uncertainty.
If the Moon or a planet is below the horizon, it is left out. Unknown event times are never silently presented as known: the designer uses and labels 22:00 local time. Daylight-saving gaps and repeated hours require you to check the time.
One date, three skies
First change only the time. Then compare two places at the same instant. These simplified diagrams show why a date alone cannot describe your sky.
May 14, 2024
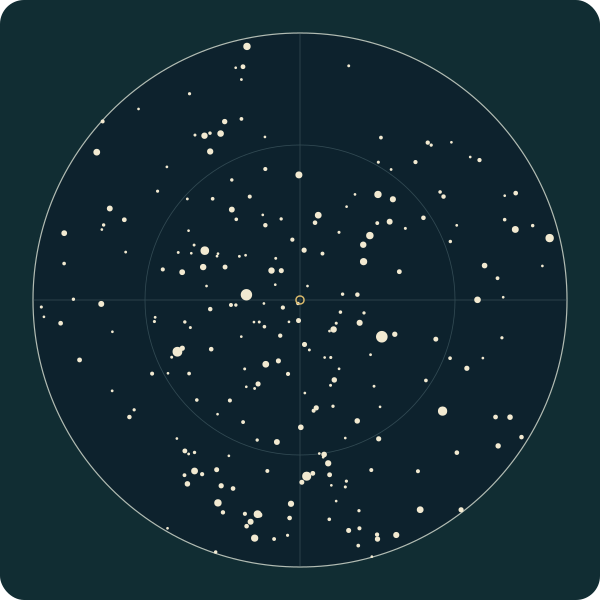
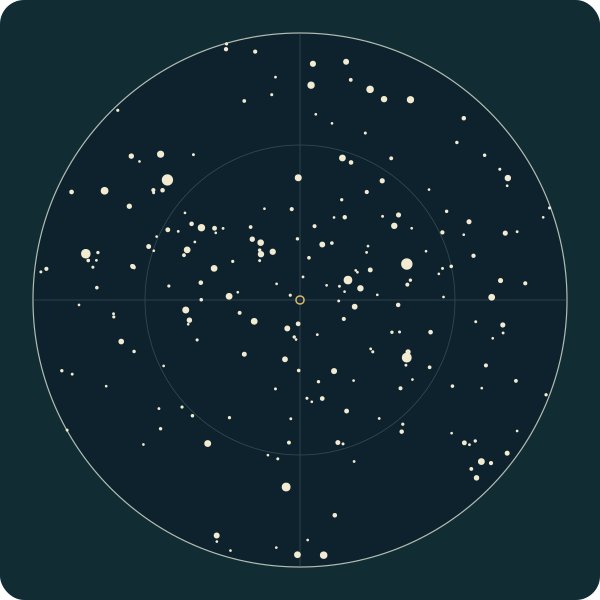
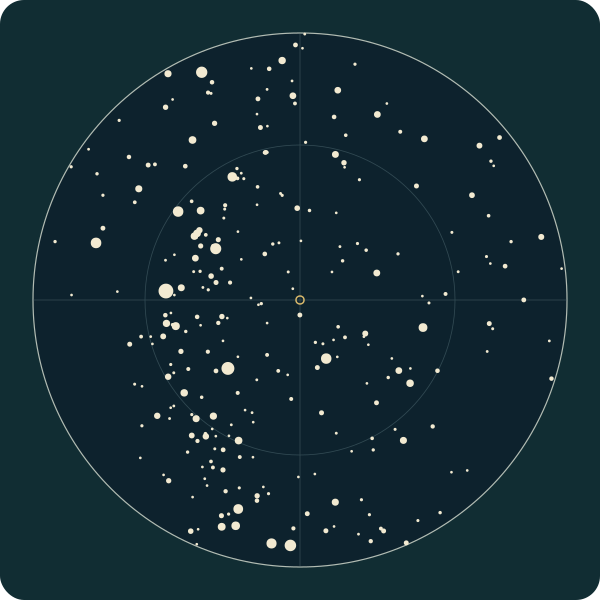
North is up, east is left and the small central ring marks the point overhead. The outer circle is the geometric horizon.
Compare charts 1 and 2: six hours changes both the positions and which stars are above the horizon. Compare charts 1 and 3: the instant is identical, but the place changes the sky.
These diagrams show only catalogue stars with magnitude 4 or brighter. The counts describe this selected dataset, not how many stars a person could see. Daylight, weather and light pollution are not simulated; the daytime charts still contain stars.
Inputs, method and reuse
Calculated by KeptStars Team on October 9, 2026 using the live designer’s fixed J2000 catalogue and stereographic projection. This demonstration omits precession, proper motion, atmospheric refraction, the Moon, planets and Milky Way. It is not a final artwork proof.
- Madrid · starting point
Europe/Madrid · Latitude / longitude: 40.4168, -3.7038
Download this diagram (SVG) - Madrid · six hours later
Europe/Madrid · Latitude / longitude: 40.4168, -3.7038
Download this diagram (SVG) - Sydney · same instant as the first chart
Australia/Sydney · Latitude / longitude: -33.8688, 151.2093
Download this diagram (SVG)
Download inputs and plotted coordinates (JSON)
Download the calculation (JavaScript)
Download spreadsheet tables (CSV)
Chart inputs · CSV · Plotted stars · CSV
Data dictionary and reuse notes (English)
Suggested citation
KeptStars Team (2026). One date, three skies: controlled time and location star-chart examples. HYG v4.1 / David Nash, Astronexus; selection and projection by KeptStars. CC BY-SA 4.0.
keptstars.com/our-sky#three-skies
You may reuse these adapted diagrams with attribution and under the same CC BY-SA 4.0 licence. Credit HYG v4.1 / David Nash, Astronexus, and KeptStars for the selection and projection.
Data and image credits
- HYG v4.1, David Nash / Astronexus — CC BY-SA 4.0. Our browser dataset filters to magnitude 6.5, removes the Sun and rounds coordinates. The adapted dataset uses the same licence.
- Milky Way: ESO/S. Brunier — CC BY 4.0. The panorama is filtered, projected, desaturated and tone-mapped.
- NASA/JPL-Caltech: planet imagery, with the individual mission and agency credits. Final files must retain asset-specific credits. NASA does not endorse this product.
- d3-celestial, Olaf Frohn — BSD-3-Clause: constellation geometry.
- JPL DE421 / Skyfield: ephemerides. Montserrat / Cormorant Garamond: SIL Open Font License.
Your purchased PDF and PNG are available after payment and approval of the final artwork. Printing is arranged separately.
Read the astronomy, gift and printing guides · Back to the designer