How common is your birthday? England and Wales, 1995–2025
Published on · Reviewed on
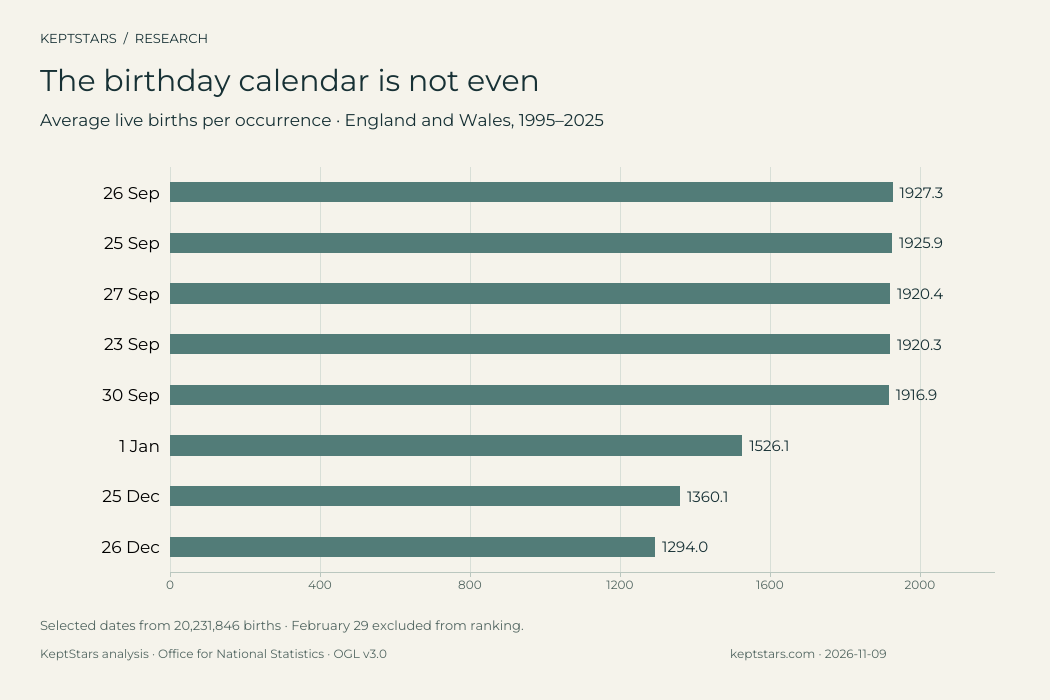
September 26 was the most common birthday across 1995–2025 in England and Wales; December 26 was the least common regular calendar date. All ten leading dates fell in September. In 2025 alone, however, May 28 ranked first. The period you choose changes the answer.
We analyzed 20,231,846 live births in the Office for National Statistics’ daily records. The useful finding is not just a winning date. It is how a birthday can rank near the middle over three decades and still lead a single year. Here you can check the long view, the latest complete year and the limits of both.
The main findings from 20.2 million births
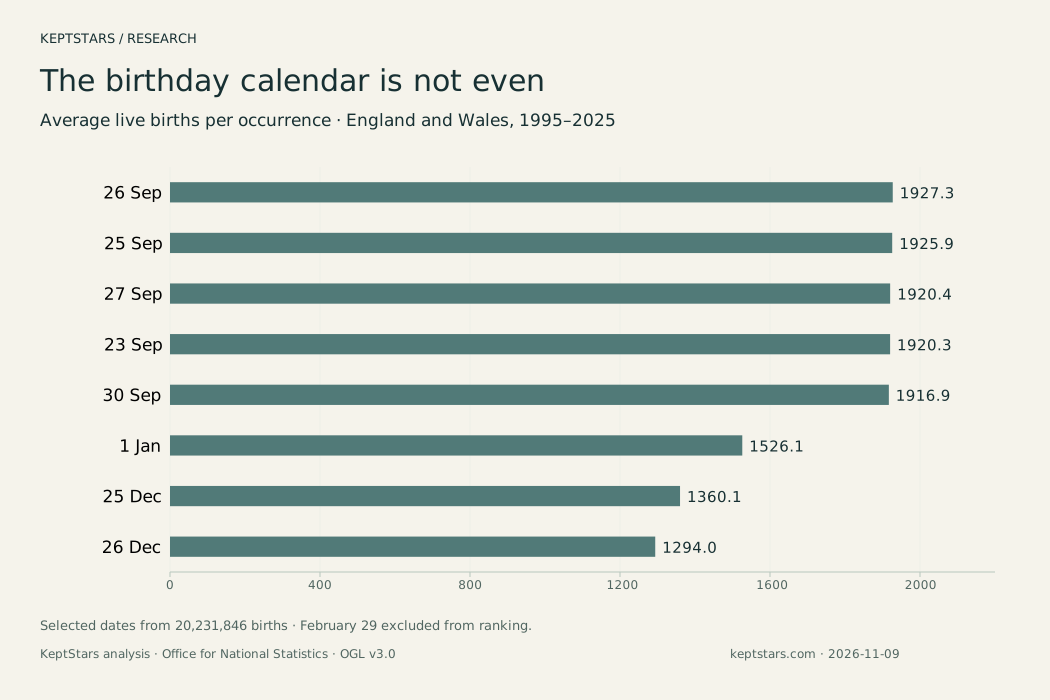
- Every date in the long-term top ten falls in September. September 26 leads with 59,747 births across 31 occurrences: an average of 1,927.3 each year.
- December 26 is the least common regular date. It recorded 40,113 births, or 1,294.0 per occurrence. September 26 recorded about 49% more births over the same period.
- The latest year has a different leader. May 28 recorded 1,844 births in 2025. In the 31-year ranking it is 168th.
- There were 18 different annual winning dates in 31 years. A long-term pattern is not a prediction for a particular year.
The top two long-term dates are close: September 26 has only 45 more recorded births than September 25 across the whole period. That gap is about 1.5 births per year. The September cluster is more meaningful than treating first place as an immutable fact.
| Date | Average live births per occurrence |
|---|---|
| 26 Sep | 1927.3 |
| 25 Sep | 1925.9 |
| 27 Sep | 1920.4 |
| 23 Sep | 1920.3 |
| 30 Sep | 1916.9 |
| 1 Jan | 1526.1 |
| 25 Dec | 1360.1 |
| 26 Dec | 1294.0 |
Look up a birthday
Choose a month and day to compare its 1995–2025 total and rank with its 2025 count and rank. A lower rank means more recorded births. Equal counts receive equal ranks; the next rank skips the corresponding positions.
The lookup covers births in England and Wales. It does not count everyone alive who shares your birthday, and it does not describe the US or the whole UK. February 29 is shown separately because it occurred only eight times during the study.
Loading the data…
Why 2025 tells a different story
May 28 topped 2025 with 1,844 births, five more than September 15. Meanwhile September 26, the long-term leader, ranked 102nd in 2025 with 1,740 births. Neither result contradicts the other: one describes a single calendar year; the other pools 31 years.
Calendar dates also fall on different weekdays from year to year. These tables show when births were recorded as occurring; they do not establish why a date rose or fell. We have not attributed the pattern to conception timing, medical scheduling or a particular holiday.
For a cautious view of change, we also compared 1995–2004 with 2016–2025, adjusting each year for its total births and number of days. September 25 led the earlier period; September 20 led the later one. September remained prominent, even though the exact leader moved. The downloadable rankings include both indices so the comparison can be checked.
Christmas dates sit near the bottom
Across 1995–2025, December 26 ranks last among the 365 regular dates, followed by December 25 and January 1. December 26 was also the least common date in 27 of the 31 individual years.
In 2025, December 26 recorded 1,052 births and December 25 recorded 1,053: just one birth separates them. Those are observed counts, not a reason to attach meaning to the difference between two neighboring ranks.
Calling December 26 the “rarest birthday” without a place and period leaves out essential information. Our result applies to this England and Wales dataset. A different country, a different generation or a count of current residents may give a different answer.
February 29 needs its own comparison
There were eight February 29s between 1995 and 2025. Together they accounted for 13,960 births, an average of 1,745 per occurrence. Comparing that total directly with a date that occurred 31 times would mainly measure the calendar.
We therefore exclude February 29 from the regular-date ranking and show its total, eight occurrences and per-occurrence average separately. Its low combined total does not mean unusually few babies arrived on each leap day. There was no February 29 in 2025, so its latest-year count is unavailable rather than zero.
Data, method and downloads
Source: the ONS birth registrations dataset, 2025 edition, released September 8, 2026. We used Table 12, covering 1995–2025, and checked each annual sum against Table 6. All 31 totals matched. We also checked all 366 per-occurrence averages, rounded to whole births, against the ONS published chart data.
- Add each month-and-day’s counts across the years in which that date existed.
- Divide by its occurrences: 31 for regular dates and eight for February 29.
- Rank the 365 regular dates using unrounded totals. A date’s rank is one plus the number of dates with a larger count.
- For the decade comparison only, divide each date’s count by its year’s total, multiply by that year’s number of days and by 100, then average the annual indices. An index of 100 represents an even daily distribution within a year.
These are live-birth counts, not survey estimates or a count of people currently alive. ONS includes births occurring and registered in England and Wales, including births to mothers resident elsewhere. A small number of late registrations enter the following year under ONS rules. We do not infer causes, and translations preserve this geographic scope.
Contains public sector information licensed under the Open Government Licence v3.0. Source: Office for National Statistics. Calculations and presentation: KeptStars Team. The files below contain the daily observations, rankings, annual winners and reproducible calculation method.
A common date can still hold one particular story
A ranking tells you how often a date appears in a dataset. It cannot tell you what that day means to your family. If you want to preserve the moment in a birth star map, the useful inputs are the date, place and time. Our guide to the sky on a particular date explains why the time matters and how to label an illustrative time when the real one is unknown.
Download the data
- birthday-rankings-england-wales.csv · CSV
- births-by-date-1995-2025.csv · CSV
- annual-most-common-birthdays.csv · CSV
- Method and reproducible files · ZIP
- Reusable chart: PNG · SVG · PDF
CSV column names and reproducibility notes are in English. Charts and this article are localized.
Open Government Licence v3.0 · KeptStars analysis · Office for National Statistics · OGL v3.0
What is the most common birthday in England and Wales?
September 26 leads the combined 1995–2025 records with 59,747 live births. In 2025 alone, May 28 leads with 1,844. Always specify the period when quoting the result.
What is the least common birthday?
Among regular calendar dates, December 26 is least common in this 1995–2025 England and Wales dataset, with 40,113 births. February 29 is reported separately because it occurred only eight times.
Does this tell me how many people share my birthday?
It counts registered live births during 1995–2025 in England and Wales. It does not account for deaths, migration, births outside the area or births outside those years, so it is not a count of everyone alive who shares your birthday.
Can I reuse the data or cite the findings?
Yes. The ONS source is available under the Open Government Licence v3.0. Credit the Office for National Statistics for the data and KeptStars Team for this analysis, preserve the England and Wales and 1995–2025 scope, and link to the study and source.
Sources and notes
Research by KeptStars Team. Scope, assumptions and limitations are explained in the method section.